During my time exploring Tableau Public, I decided to investigate various aspects regarding to the Covid-19 disease.

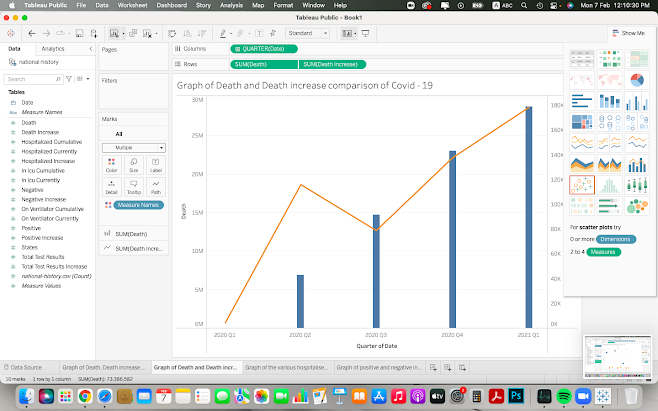
For my first graph, I recorded the death count, the increase of deaths, and the number of patients who need intensive care units (ICU) due to Covid-19. The format of the graph is a bar graph with the maximum amount is represented by a circle.
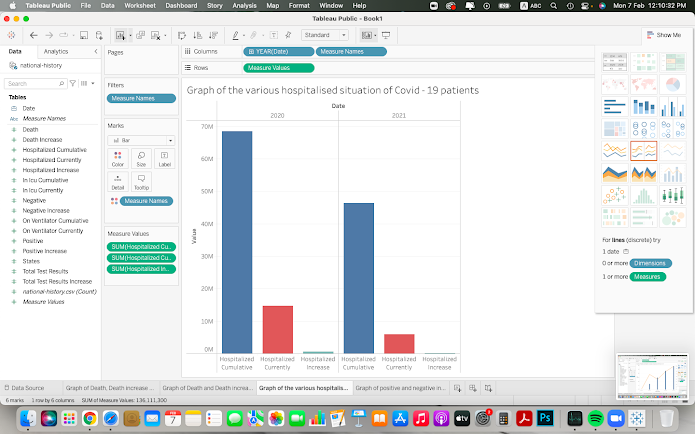
For my third graph, I decided to take the data from various aspects of hospitalized patients and compare them against each other during 2020 and 2021 with a bar graph.

This final graph represents the number of positive and negative results in 2020 and compared it to 2021 with a bubble chart.
No comments:
Post a Comment